Note
Click here to download the full example code
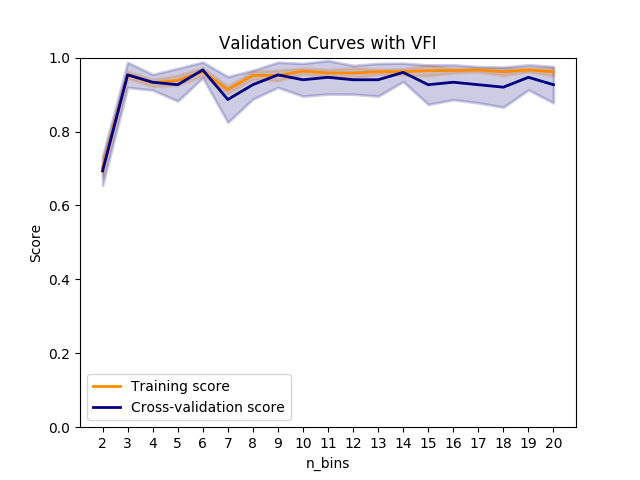
Sensitivity analysis
In this plot we perform a sensitivity analysis of the n_bins parameter and we can see how the different values affect the performance of the classifier.
print(__doc__)

import matplotlib.pyplot as plt
import numpy as np
import vfi

from sklearn.datasets import load_iris
from sklearn.model_selection import validation_curve

X, y = load_iris(1)

param_range = range(2, 21)
train_scores, test_scores = validation_curve(
    vfi.VFI(),
    X,
    y,
    param_name="n_bins",
    param_range=param_range,
    cv=5,
    scoring="accuracy",
    n_jobs=1,
)
train_scores_mean = np.mean(train_scores, axis=1)
train_scores_std = np.std(train_scores, axis=1)
test_scores_mean = np.mean(test_scores, axis=1)
test_scores_std = np.std(test_scores, axis=1)

plt.title("Validation Curves with VFI")
plt.xlabel("n_bins")
plt.ylabel("Score")
plt.ylim(0.0, 1.0)
plt.xticks(param_range)

lw = 2
plt.plot(
    param_range, train_scores_mean, label="Training score", color="darkorange", lw=lw
)
plt.fill_between(
    param_range,
    train_scores_mean - train_scores_std,
    train_scores_mean + train_scores_std,
    alpha=0.2,
    color="darkorange",
    lw=lw,
)
plt.plot(
    param_range, test_scores_mean, label="Cross-validation score", color="navy", lw=lw
)
plt.fill_between(
    param_range,
    test_scores_mean - test_scores_std,
    test_scores_mean + test_scores_std,
    alpha=0.2,
    color="navy",
    lw=lw,
)
plt.legend(loc="best")
plt.show()
Total running time of the script: ( 0 minutes 5.912 seconds)